close all;
figure;
Img_Raw = imread('TheDress.jpg');
SF1 = [40,100;230,300];
SF2 = [205,275;190,260];
Img_Patch1 = Img_Raw( SF1(1,1):SF1(1,2) , SF1(2,1):SF1(2,2) ,:);
Img_Patch1 = double(Img_Patch1);
Img_Patch2 = Img_Raw( SF2(1,1):SF2(1,2) , SF2(2,1):SF2(2,2) ,:);
Img_Patch2 = double(Img_Patch2);
ImgToDisp_01 = Img_Raw;
for y = (SF1(1,1)-5):1:(SF1(1,2)+5)
for x = (SF1(2,1)-5):1:(SF1(2,2)+5)
ImgToDisp_01(y,x,1) = uint8(255);
ImgToDisp_01(y,x,2) = uint8(0);
ImgToDisp_01(y,x,3) = uint8(0);
end
end
for y = (SF2(1,1)-5):1:(SF2(1,2)+5)
for x = (SF2(2,1)-5):1:(SF2(2,2)+5)
ImgToDisp_01(y,x,1) = uint8(255);
ImgToDisp_01(y,x,2) = uint8(0);
ImgToDisp_01(y,x,3) = uint8(0);
end
end
ImgToDisp_01( SF1(1,1):SF1(1,2) , SF1(2,1):SF1(2,2) ,:) = uint8(Img_Patch1);
ImgToDisp_01( SF2(1,1):SF2(1,2) , SF2(2,1):SF2(2,2) ,:) = uint8(Img_Patch2);
FigureHandle = subplot(2,4,[1,5]);
imshow(ImgToDisp_01);
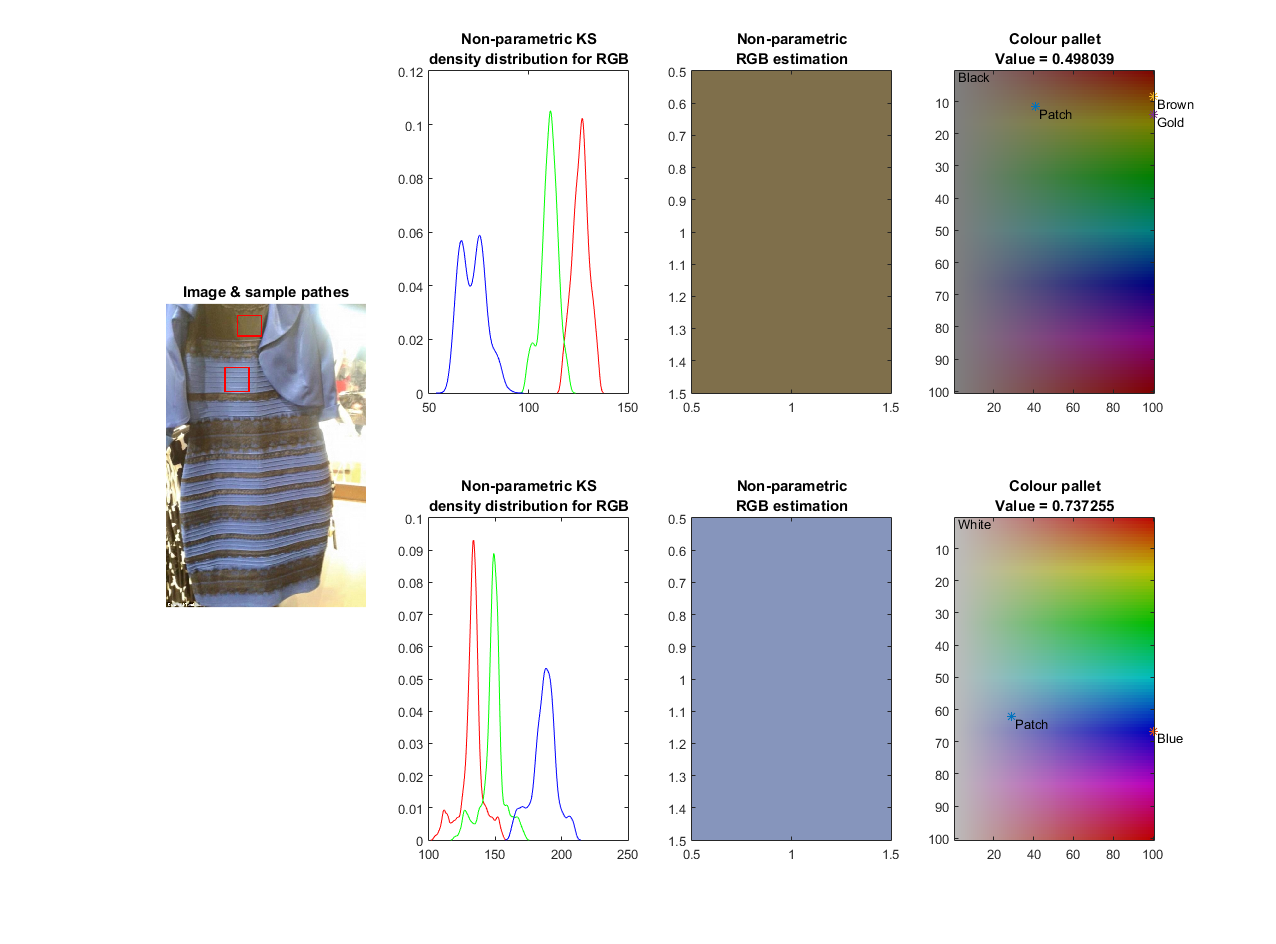
title(FigureHandle,'Image & sample pathes');
for i_Patch = 1:1:2
eval(sprintf('Img = Img_Patch%i;',i_Patch));
RedImg = Img(:,:,1);
GreenImg = Img(:,:,2);
BlueImg = Img(:,:,3);
Img_HSV = rgb2hsv(Img./255);
HueImage = Img_HSV(:,:,1);
SatImage = Img_HSV(:,:,2);
ValImage = Img_HSV(:,:,3);
HueVector = reshape(HueImage,numel(HueImage),1);
SatVector = reshape(SatImage,numel(SatImage),1);
ValVector = reshape(ValImage,numel(ValImage),1);
MeanVal = mean(ValVector,1);
StdVal = std(ValVector,0,1);
Mask = false(size(ValImage));
for y = 1:1:size(ValImage,1)
for x = 1:1:size(ValImage,2)
if (abs(ValImage(y,x) - MeanVal) / StdVal) < 2
Mask(y,x) = true;
end
end
end
ThresholdedRed = double(Mask) .* RedImg;
ThresholdedGreen = double(Mask) .* GreenImg;
ThresholdedBlue = double(Mask) .* BlueImg;
ThresholdedImg = nan(size(Img));
ThresholdedImg(:,:,1) = ThresholdedRed;
ThresholdedImg(:,:,2) = ThresholdedGreen;
ThresholdedImg(:,:,3) = ThresholdedBlue;
RGBs = nan(sum(sum(double(Mask),2),1),3);
i_RGBs = 0;
for x_Mask = 1:1:size(Mask,2)
for y_Mask = 1:1:size(Mask,1)
if Mask(y_Mask,x_Mask)
i_RGBs = i_RGBs + 1;
RGBs(i_RGBs,1) = RedImg(y_Mask,x_Mask);
RGBs(i_RGBs,2) = GreenImg(y_Mask,x_Mask);
RGBs(i_RGBs,3) = BlueImg(y_Mask,x_Mask);
end
end
end
[Masked_Red_Density,Masked_Red_Intensity] = ksdensity(RGBs(:,1));
Masked_Red_Density = Masked_Red_Density';
Masked_Red_Intensity = Masked_Red_Intensity';
[Masked_Green_Density,Masked_Green_Intensity] = ksdensity(RGBs(:,2));
Masked_Green_Density = Masked_Green_Density';
Masked_Green_Intensity = Masked_Green_Intensity';
[Masked_Blue_Density,Masked_Blue_Intensity] = ksdensity(RGBs(:,3));
Masked_Blue_Density = Masked_Blue_Density';
Masked_Blue_Intensity = Masked_Blue_Intensity';
FigureHandle = subplot(2,4,2+((i_Patch-1) * 4));
plot(Masked_Red_Intensity,Masked_Red_Density,'-r',Masked_Green_Intensity,Masked_Green_Density,'-g',Masked_Blue_Intensity,Masked_Blue_Density,'-b');
title(FigureHandle,sprintf('Non-parametric KS%cdensity distribution for RGB',10));
[~,i_Max_Red_Density] = max(Masked_Red_Density,[],1);
[~,i_Max_Green_Density] = max(Masked_Green_Density,[],1);
[~,i_Max_Blue_Density] = max(Masked_Blue_Density,[],1);
NpMean_RGB = [Masked_Red_Intensity(i_Max_Red_Density,1),Masked_Green_Intensity(i_Max_Green_Density,1),Masked_Blue_Intensity(i_Max_Blue_Density,1)];
FigureHandle = subplot(2,4,3+((i_Patch-1) * 4));
image(uint8(reshape(NpMean_RGB,1,1,3)));
title(FigureHandle,sprintf('Non-parametric%cRGB estimation',10));
NpMean_HSV = rgb2hsv(uint8(reshape(NpMean_RGB,1,1,3)));
SizeColourMat = 100;
LabelOffest = [(+0.02*SizeColourMat),(+0.02*SizeColourMat)];
ColourMat = nan(SizeColourMat,SizeColourMat,3);
for y = 1:1:SizeColourMat
for x = 1:1:SizeColourMat
ColourMat(y,x,:) = hsv2rgb(reshape([(y/SizeColourMat),(x/SizeColourMat),NpMean_HSV(1,1,3)],1,1,3));
end
end
ColourMat = ColourMat.*255;
FigureHandle = subplot(2,4,4+((i_Patch-1) * 4));
image(uint8(ColourMat));
title(FigureHandle,sprintf('Colour pallet%cValue = %f',10,NpMean_HSV(1,1,3)));
hold on;
NpMean_YX = [(NpMean_HSV(1,1,1)*SizeColourMat),(NpMean_HSV(1,1,2)*SizeColourMat)];
plot(NpMean_YX(1,2),NpMean_YX(1,1),'*');
text((NpMean_YX(1,2)+LabelOffest(1,2)),(NpMean_YX(1,1)+LabelOffest(1,1)),'Patch');
if i_Patch == 1
Black_HSV = rgb2hsv(uint8(reshape([0,0,0],1,1,3)));
Black_YX = [(Black_HSV(1,1,1)*SizeColourMat),(Black_HSV(1,1,2)*SizeColourMat)];
plot(Black_YX(1,2),Black_YX(1,1),'*');
text((Black_YX(1,2)+LabelOffest(1,2)),(Black_YX(1,1)+LabelOffest(1,1)),'Black');
Brown_HSV = rgb2hsv(uint8(reshape([150,75,0],1,1,3)));
Brown_YX = [(Brown_HSV(1,1,1)*SizeColourMat),(Brown_HSV(1,1,2)*SizeColourMat)];
plot(Brown_YX(1,2),Brown_YX(1,1),'*');
text((Brown_YX(1,2)+LabelOffest(1,2)),(Brown_YX(1,1)+LabelOffest(1,1)),'Brown');
Gold_HSV = rgb2hsv(uint8(reshape([255,215,0],1,1,3)));
Gold_YX = [(Gold_HSV(1,1,1)*SizeColourMat),(Gold_HSV(1,1,2)*SizeColourMat)];
plot(Gold_YX(1,2),Gold_YX(1,1),'*');
text((Gold_YX(1,2)+LabelOffest(1,2)),(Gold_YX(1,1)+LabelOffest(1,1)),'Gold');
else
Blue_HSV = rgb2hsv(uint8(reshape([0,0,255],1,1,3)));
Blue_YX = [(Blue_HSV(1,1,1)*SizeColourMat),(Blue_HSV(1,1,2)*SizeColourMat)];
plot(Blue_YX(1,2),Blue_YX(1,1),'*');
text((Blue_YX(1,2)+LabelOffest(1,2)),(Blue_YX(1,1)+LabelOffest(1,1)),'Blue');
White_HSV = rgb2hsv(uint8(reshape([255,255,255],1,1,3)));
White_YX = [(White_HSV(1,1,1)*SizeColourMat),(White_HSV(1,1,2)*SizeColourMat)];
plot(White_YX(1,2),White_YX(1,1),'*');
text((White_YX(1,2)+LabelOffest(1,2)),(White_YX(1,1)+LabelOffest(1,1)),'White');
end
hold off;
end
set(gcf, 'Position', get(0,'Screensize'));